
by Gary Mintchell | Nov 11, 2014 | Automation, Internet of Things, Manufacturing IT, News, Operations Management, Software
 I missed the GE Intelligent Platforms User Summit a couple of weeks ago. But that doesn’t mean that I didn’t get a veritable flood of information from the event.
I wrote here about a GE, Intel, Cisco partnership enabling part of the Industrial Internet vision of GE. Then I had the opportunity to interview Rich Carpenter, GE-IP CTO. Finally, there was news about opening up the Predix platform.
The summit–Making the Industrial Internet Real–attracted more than 650 attendees according to the press release. They heard executives from leading global manufacturing and industrial companies such as AkzoNobel, ConocoPhillips, and Delta Air Lines, as well as CIOs from GE’s industrial businesses: GE Transportation, GE Lighting, GE Aviation and GE Nuclear.
Industrial Internet Explained
“The Industrial Internet is all about intelligent machines, advanced analytics, and people at work, coming together to solve problems as never before,” said Brian Courtney, General Manager of GE’s Industrial Data Intelligence product group. “It’s about gathering much more data, Industrial Big Data, more efficiently and over longer periods of time, using Advanced Analytics to interpret this data in more meaningful ways. PMAS brings this to life to help customers collect, organize, and analyze equipment and process data to maximize productive output and lower operating costs, with fast payback and low risk.”
Scorcard Partnership
The company also announced that it is partnering with Webalo to mobilize business intelligence combined with operational awareness, enabled by the Industrial Internet. Proficy Scorecard, built on Webalo’s secure, scalable, high-productivity mobile app development platform, Webalo Pro Appliance, and GE’s Proficy Mobile, generates real-time views of information, from multiple data sources within the company, to provide actionable “Scorecards” for all departments in an organization.
Proficy Scorecard is enabled by GE’s Proficy Mobile solution, which allows industrial environments of all kinds to provide engineers, on their desktop or on a mobile tablet computer or smart phone, with real-time information about the state of operations. With Proficy Scorecard views in hand, engineers can then make the connection between business intelligence and operations making them more productive and efficient. And, because it is mobile, critical data helps users easily, and quickly, monitor the KPIs the business cares most about while drilling down to the operational details and making the Industrial Internet real in their company.
by Gary Mintchell | Apr 1, 2014 | Automation, Technology
“Gary, what are you hearing about PackML lately,” asked an acquaintance the other day. “I’m getting a lot of requests for it.” My friend is a software integrator working primarily in factory automation and MES.
Developed by a working group of engineers from companies that use packaging machines, companies that design and manufacture packaging machines, and suppliers of machine automation and control, PackML defines the various “states” of a machine and provides a common vocabulary of terms.
Companies that use such machines favored the development of PackML, because it would make user interfaces and machine operations standard. This makes operator training and machine operations easier and better. Nestle and P&G are examples of companies who have pushed hard for the development of the standard.
Thought models help not only the companies who use the machines, it should help the machine builders, too. By structuring not only the programming, but also the design of the machine, machine builders can both satisfy customers, perhaps with a unique capability, but also reduce future design cost and time-to-market.
PackML was developed by an organization composed of technology developers, machine builders and end user companies. The Organization for Machine Automation and Control (OMAC) Packaging Working Group developed the state model borrowing from the ISA88 standard (ISA88.05). The group itself has been quiet for the past few years, but according to my friend, companies are beginning to request it in the machines they procure.
Taking the thought process one step further, companies are beginning to look at their entire manufacturing enterprise by applying the ISA95 model to operations. Once companies understand operations and data movements, then they can begin applying information technology solutions from manufacturing execution systems (MES) suppliers.
If the machines are modeled, and operations are modeled, and data flows are defined, then connections can be made to automatically move real-time data from the machine into MES applications. These applications provide the contextualized information required to adequately manage manufacturing.
Machine builders who provide machines based on the state model that is understandable to their customers and at the same time provide pathways for information flow—such as built-in OPC servers—have a competitive advantage over their peers. Manufacturers who use these standards can benefit from using the information.
Research by LNS Research in collaboration with MESA has revealed that companies who use their MES applications have benefited from many annual performance improvements.
The recent report notes, “The average annual performance improvements listed below are each combinations of several different metrics and KPIs. The results shown are for manufacturers that indicated measuring each of the listed metrics. In some cases, such as in the financials category, up to 10 different variables were included in the calculation. This data shows improvements in those categories based on 2013 compared to 2012.”
Optimum asset performance
Add to the mix that all these standards aid interoperability of systems and data flow. When you can get data flowing from machines and processes into your management systems—MES, CMMS and EAM—then information about the state of the plant is at your fingertips.

by Gary Mintchell | Mar 6, 2014 | Data Management, Operations Management, Software
I have long known the benefits that are possible with the proper implementation of the Layer 3 software commonly known as manufacturing execution software or MES. The ISA 95 framework model calls the application Manufacturing Operations Management, or MOM.
At its best, implementing MOM makes manufacturing professionals think about their processes. The software collects data which managers and engineers can use to find problems that continuous improvement teams can attack. It gives the teams before and after data to show if improvements have been made. MOM should be a servant of operations managers, not the other way around.
The MESA International organization exists to promote such an intelligent application of its supplier-members’ software. This year its “Metrics that Matter” research is being conducted with the help of LNS Research. Although I think you can still participate in the survey, LNS has blogged some preliminary findings. They are interesting.
It notes that over 200 responses to the survey have been evaluated.
“One set of data we’re eager to highlight first is the average annual performance improvements across the eight different high-level KPI categories manufacturing professionals were asked about. These categories include financials, inventory, innovation, responsiveness, efficiency, quality, maintenance, and compliance.”
“The fact that each category below shows improvements is encouraging, and a positive sign for the manufacturing sector in general. In 2014, gaining market share in today’s competitive global economy will be a matter of building on the momentum of these improvements and finding ways to sustain and accelerate them.”
Please visit the blog to read the details, but here are teasers:
- Financial, Average Annual Performance Improvement: 8.6%
- Inventory, Average Annual Performance Improvement: 15.0%
- Innovation, Average Annual Performance Improvement: 7.8%
- Responsiveness, Average Annual Performance Improvement: 10.0%
- Efficiency, Average Annual Performance Improvement: 17.0%
- Quality, Average Annual Performance Improvement: 13.7%
- Maintenance, Average Annual Performance Improvement: 14.9%
- Compliance, Average Annual Performance Improvement: 18.5%
Check it out and let me know what you think.
by Gary Mintchell | Nov 25, 2013 | Operations Management, Software
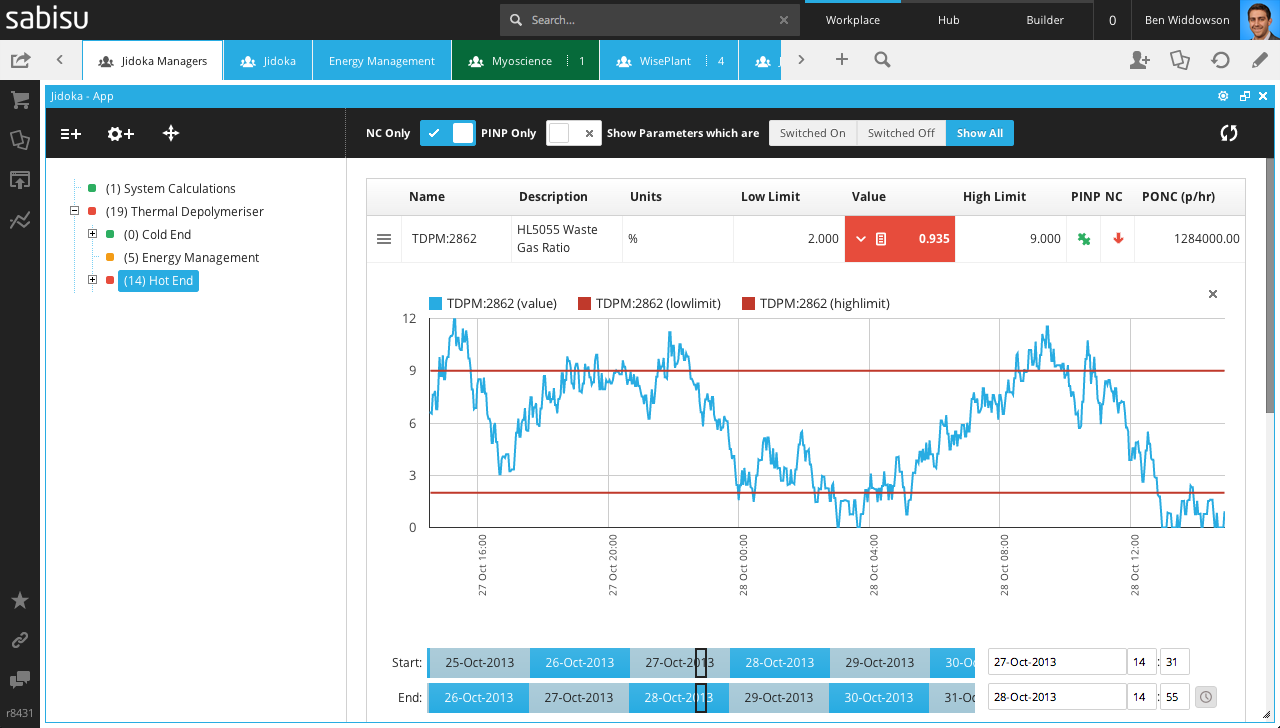
 Sabisu, a British company with collaboration platform of the same name has released what it calls Jidoka—automation with a human touch. Ben Widdowson, writing in the company blog, says, “Our solution that makes it quick and easy to identify sub-optimal process parameters and prioritise them by tangible costs. We think you’re going to love it.”
Jidoka consists of the following components, which each customer arranges and configures into their own solution:
- Shika data persistence layer
- Real-time, non-linear capable statistics engine
- On-demand, embedded trending
- Ranking engine
The focus is on oil & gas and petrochemicals, but Widdowson says Jidoka is an engine for calculating the profit/cost impact of any business KPI.
Jidoka delivers the following capabilities:
- Defining and calculating KPIs and process variables in real-time
- Identifying bottom-line impacting opportunities
- Prioritising the most valuable KPIs.
Jidoka is applicable to any KPI or any process.
Controlling your process
Process variables can be navigated and manipulated much more easily than the previous version. Navigation and editing are so closely aligned that it made sense to simplify them to give a much better experience. And it’s very, very fast.
You can configure Jidoka around business initiatives, production processes or key areas of focus; it’s easy to get around and see what you need to focus your attention on. So if you spot a problem you can instantly drill down or filter to find the parts of the process that are causing the issue.
Watch the latest trends
One of the most popular features in Jidoka is real-time, on-demand trends leveraging the proprietary Shika data persistence layer. Using the technology developed for the Jidoka Ranking Widget, we’ve embedded trends directly making them even quicker and easier to use. The new upper and lower limits visualise operating envelopes and you can zoom right in to see exactly when limits have been breached.
Managing your process representation
“The new Jidoka makes it really easy to manage how you represent your process. You can add, rename or delete nodes right within the list by using the simple icons.
“We’ve improved the process of organising your process hierarchy making it much quicker and easier. Simply click on the ‘drag mode’ icon to enter edit mode and you’ll notice each variable and node has a new ‘move’ icon. You can now drag your variables from one node to another.”
Editing process variables
Teams are central to Sabisu so the platform is built around Communities. It’s easier for your team to manage process variables.