
by Gary Mintchell | Dec 17, 2019 | Asset Performance Management, Data Management, Internet of Things, Manufacturing IT, Software
Suppliers of manufacturing software, some from surprising places, are putting sizable investments into products that will help customers reap the rewards of digitalization. Today, I’m looking at both ABB and Emerson Automation Solutions. Previously I checked out GE Digital and Rockwell Automation. Each has taken a slightly different course toward the goal, but notice the common thread of enhancing software products to help customers prosper.
ABB enhances manufacturing management technology
The new version of ABB Ability Manufacturing Operations Management will offer new features including:
- Enhanced user experience based on new HTML 5 web client;
- A new smart interactive dashboard application that provides greater visibility and collaboration;
- A new statistical process control (SPC) application, to determine if each process is in a state of control;
- A new Batch Compare application – for advanced batch analysis.
“ABB Ability Manufacturing Operations Management is a comprehensive, scalable and modular software suite that optimizes visibility, knowledge and control throughout the operations domain,” said Narasimham Parimi, Head of Digital Products – Product Management, Process Control Platform. “This release provides a range of rich new functionality and a new enhanced user experience that enables operations to become more productive and responsive.”
ABB Ability Manufacturing Operations Management is designed to simplify production management by enabling performance monitoring, downtime management, and maintenance support, as well as providing statistical production analysis tools. It provides solutions and tools to facilitate the collection, consolidation and distribution of production, quality and energy information via the plant’s web-based reports, trends, and graphs.
A new, self-service dashboard application promotes increased collaboration, providing visibility from shop floor to top floor and spanning IT and OT environments. It increases data connectivity to all apps and modules within the MOM suite, combining historic and manufacturing data and providing the user with improved customization capabilities. Dashboards can be shared amongst users, further promoting collaboration between teams. Trends and events are displayed together, which enables customers to identify issues and opportunities enabling informed and timely decisions.
The new common services platform features an HTML 5 web platform that runs across all suites ensuring customers have a seamless user experience, so that applications can be viewed on different devices right down to a 10-inch tablet.
Statistical data process control (SPC) is used in manufacturing to determine if each process is in a state of control. The new SPC application works across all the different apps and modules and helps the user to improve quality and production related performance.
In addition to the existing Batch View and Batch Investigate features, a comparison option has been added to the platform’s batch analysis applications, allowing different types of comparison.
Cyber security remains one of the key issues in the advancement of Industry 4.0, and the new features in MOM include enhanced security.
Emerson Expands Analytics Platform
Plantweb Insight platform adds two new Pervasive Sensing applications that manage wireless networks more efficiently with a singular interface to the enterprise.
Emerson has added two new IIoT solutions to its Plantweb Insight data analytics platform that will enable industrial facilities to transform the way they manage their enterprise-level wireless network infrastructure.
As digitalization and wireless technology adoption continue to rapidly expand in industrial facilities throughout the world, the need for greater visibility of network infrastructure performance is key. These new Plantweb Insight applications provide a quick-to-implement, scalable IIoT solution that helps customers advance their digital transformation strategies and achieve greater operational efficiencies.
The new Plantweb Insight Network Management application provides continuous, centralized monitoring of WirelessHART networks. This first-of-its-kind application provides a singular, consolidated view of the status of all wireless networks in a facility, with embedded expertise and guidance for advanced network management.
A key feature of the Plantweb Insight Network Management application is a configurable mesh network diagram, providing visualization of network design and connections along with device-specific information. It also provides an exportable record of syslog alerts, network details outlining conformance to network best practices and more.
While the new network management application provides a holistic look at wireless networks, the Plantweb Insight Power Module Management application drills down to the device level, allowing facilities to keep their wireless devices appropriately powered so they can continuously transmit key monitoring data. By aggregating power module statuses, users can evolve traditional maintenance planning and implement more efficient and cost-effective practices.
“We were able to infuse a decade of experience with wireless technology into these new offerings,” said Brian Joe, wireless product manager with Emerson’s Automation Solutions business. “Our customers will now be able to manage and improve hundreds of networks through a singular interface, realizing significant efficiencies in individual network and wireless device management and maintenance.”
These new applications further enhance the Plantweb Insight platform, a set of pre-built analytics primarily focusing on monitoring key asset health. Other applications in the platform include pressure relief valve monitoring, heat exchanger monitoring and steam trap monitoring.
by Gary Mintchell | Jul 24, 2018 | Internet of Things, Operations Management
Successful digitalization requires data. Data, in turn, originates often from sensors. The Industrial Internet of Things runs on this data providing a valuable use case of tying a manufacturing enterprise together from supply chain through customer experience.
Mahesh Veerina, CEO of Cloudleaf, walked me through an application based on his company’s technology that indeed ties a supply chain in the pharma industry together. Start with sensors on approximately 5,000 pallets. Each meshes via sub-MHz unlicensed radios through 30 intelligent gateways reporting 16 million data points. Cloudleaf’s SaaS software gathers the data, performs the analytics, then feeds custom dashboards for different roles at the customer’s company. Oh, and continuous learning through Artificial Intelligence (AI) creates a virtuous cycle that constantly improves the system.
The return on investment (ROI)? Estimated at between $70 million and $100 million.
Cloudleaf has announced the next generation of its patented Sensor Fabric, the IoT-at-scale solution that optimizes management of distributed assets throughout any enterprise value chain.
Cloudleaf’s next-generation Sensor Fabric maintains an intelligent grid at the edge for global commerce, making digitization a reality for enterprise customers and value chain partners. Its easy-to-deploy intelligent sensors, gateways and cloud technologies minimize costs and maximize quality, efficiency and reporting standards. At the same time, Cloudleaf’s patented solution generates a continuous stream of increasingly predictive data that enables an enterprise to monitor, measure and manage distributed assets –– on the ground and on the fly. Key enhancements include:
• Comparative multi-location movement history maximizes yield and improves asset utilization.
• Lifecycle tracking optimizes business processes, managing dwell times, cycle times, asset condition changes and other variables.
• Value Loss analytics measure inefficiencies in asset handling, storage and usage.
• Path Modeling provides compliance tracking, monitoring and reporting.
• Next-gen control center enables on-the-fly deployment, calibration, and management of Sensor Fabric, with easy to use web and mobile dashboards.
Unlike products that occasionally add new features and functionalities, Sensor Fabric essentially upgrades itself. Tens-of-millions-per-day messaging sparks multiplier machine learning. The result is agile and actionable insights in virtually any industrial process. The longer Sensor Fabric is deployed, the smarter the industrial process is.
“We are extremely gratified by the extraordinary market acceptance that Cloudleaf is achieving,” said Veerina. “More and more extended enterprises in a wide range of industries are asking Cloudleaf to help them achieve the kinds of efficiencies and ROI that our current customers are gaining. In the very near future, we expect to begin announcing the addition of a number of industry leaders –– including internationally known household names – to our rapidly growing customer base.”
by Gary Mintchell | May 30, 2018 | Data Management, News
Data are worthless without the ability to put it into a context and present it in a simple way to decision makers—no matter where in the company they reside. Enter Ocean Data Systems (ODS) and its product Dream Report.
Note: Dream Report obviously is an advertiser on this blog. However, I’m not a trade magazine, so writing about advertisers isn’t mandatory. I’ve known the Marketing VP for almost 20 years, and he has always represented quality products. I pass this along not as a reviewer but because I think it’s useful.
Ocean Data Systems (ODS) announced that Dream Report version 4.82 is posted and available for download. Along with a broad array of Customer Software Change Requests (SCRs), this release delivers on a theme of Partner Connectivity. Dream Report is now the official solution for the Aveva – ClearSCADA solution and version 4.82 includes drivers to access historical values, historical messages and real-time values. This release also includes new connectivity for the OSIsoft – PI Historian and Asset Framework. Enhanced connectivity is also delivered for the Aveva – Wonderware Online InSight product and the Dream Report – Advanced ODBC Driver for time series data in SQL Databases.
General features and benefits improvements include an enhanced Automatic Statistic Table to add flexibility for ad-hoc analysis, new access to Table Footer data delivering the ability to enhance report calculations using table footer results and support for .xlsm (Excel File Format) to support macros.
“Each new ‘Purpose Built’ Driver added to Dream Report enables Dream Report to ideally support a new market segment and lets those customers benefit from Dream Report – Compliance Reports, Performance Dashboards and Ad-hoc Analysis,” explained Roy Kok, VP Sales and Marketing for Ocean Data Systems. “We always include enhancements that benefit our entire installed base and this release is no different. The Dream Report release notes, in the documentation directory, will detail all changes.”
Founded in 2004, Ocean Data Systems develops software solutions for industrial compliance and performance; reports, dashboards, and ad-hoc analysis and troubleshooting. Dream Report delivers both local and Internet connectivity to all major HMI/SCADA, Historian and business data sources through either proprietary or industry standard drivers. Dream Report’s markets include process, hybrid and discrete; with special functionality for Life Sciences (Pharmaceutical and Biotech), Water, Wastewater, Heat Treat, Building Automation, Energy Management and Manufacturing Operations.
These are the main features of Dream Report:
1- DATA COLLECTION
Dream Report integrates a robust communication kernel to collect data and alarms from multiple real time and historian sources. It uses OPC, OLE, and ODBC standards to connect and collect Data from different suppliers. Moreover, ODS develops custom drivers to leverage native history from SCADA systems, DCS, RTU and more….
2- DATA LOGGING
Dream Report integrates a powerful historian module to log clean and accurate data in any standard database such as SQL Server, Oracle, MySQL, Access…
This unique feature position Dream Report not only as a reporting tool, but also as the ideal solution of field Data integration for enterprise applications.
3- DATA EXTRACTION & ANALYSIS
Dream Report integrates a user friendly object library to extract Data statistics and analysis to be displayed in multiple views like tables, Bars, Pies, Charts and more…
4- REPORT DESIGN
Dream Report’s studio integrates an intuitive graphical editor to create and save state of the art reports as templates.
5- REPORT GENERATION & DISTRIBUTION
Dream Report enables to generate reports manually and automatically. The automatic mode enables to execute report on event and on schedule. When ready, reports can be automatically printed, emailed, stored and published over the web.

by Gary Mintchell | Apr 19, 2018 | Asset Performance Management, Automation, Internet of Things, Operations Management
Artificial Intelligence, always known as AI, along with its sometime companion robots leads the mainstream media hype cycle. It’s going to put everyone out of jobs, destroy civilization as we know it, and probable destroy the planet.
I lived through the Japanese robotic revolution-that-wasn’t in the 80s. Media loved stories about robots taking over and how Japan was going to rule the industrialized world because they had so many. Probing the details told an entirely different story. Japan and the US counted robots differently. What we called simple pick-and-place mechanisms they called robots.
What set Japanese industrial companies apart in those days was not technology. It was management. The Toyota Production Method (aka Lean Manufacturing) turned the manufacturing world on its head.
My take for years based on living in manufacturing and selling and installing automation has been, and still is, that much of this technology actually assisted humans—it performed the dangerous work, removing humans from danger, taking over repetitive tasks that lead to long-term stress related injuries, and performing work humans realistically couldn’t do.
Now for AI. This press release went out the other day, “With AI, humans and machines work smarter and better, together.” So, I was intrigued. How do they define AI and what does it do?
Sensai, an augmented productivity platform for manufacturing operations, recently announced the launch of its pilot program in the United States. Sensai increases throughput and decreases downtime with an AI technology that enables manufacturing operations teams to effectively monitor machinery, accurately diagnose problems before they happen and quickly implement solutions.
The company says it empowers both people and digital transformation using a cloud-based collaboration hub.
“The possibility for momentous change within manufacturing operations through digital transformation is here and now,” said Porfirio Lima, CEO of Sensai. “As an augmented productivity platform, Sensai integrates seamlessly into old or new machinery and instantly maximizes uptime and productivity by harnessing the power of real time data, analytics and predictive AI. Armed with this information, every person involved – from the shop floor to the top floor – has the power to make better and faster decisions to increase productivity. Sensai is a true digital partner for the operations and maintenance team as the manufacturing industry takes the next step in digital transformation.”
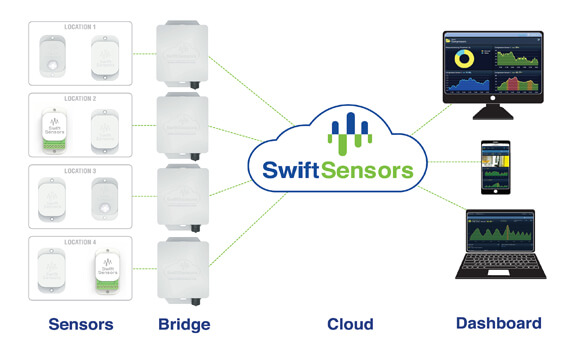
By installing a set of non-invasive wireless sensors that interconnect through a smart mesh network of gateways, Sensai collects data through its IIoT Hub, gateways and sensors, and sends it to the cloud or an on-premise location to be processed and secured. Data visualization and collaboration are fostered through user-friendly dashboards, mobile applications and cloud-based connectivity to machinery.
The AI part
Sensai’s differentiator is that it provides a full state of awareness, not only of the current status, but also of the future conditions of the people, assets and processes on the manufacturing floor. Sensai will learn a businesses’ process and systems with coaching from machine operators, process and maintenance engineers. It will then make recommendations based on repeating patterns that were not previously detected. Sensai does this by assessing the team’s experiences and historical data from the knowledge base and cross checking patterns of previous failures against a real-time feed. With this information, Sensai provides recommendations to avoid costly downtime and production shutdowns. Sensai is a true digital peer connecting variables in ways that are not humanly possible to process at the speed required on a today’s modern plant floor.
About the Pilot Program
Participation in Sensai’s pilot program is possible now for interested manufacturers. Already incorporated throughout Metalsa, a leading global manufacturer of automotive structural components, Sensai is set to digitally disrupt the manufacturing industry through AI, including those in automotive, heavy metal and stamping, construction materials, consumer goods and more.
Porfirio Lima, Sensai CEO, answered a number of follow up questions I had. (I hate when I receive press releases with lots of vague benefits and buzz words.)
1. You mention AI, What specifically is meant by AI and how is it used?
Sensai uses many different aspects of Artificial Intelligence. We are specifically focused on machine learning (ML), natural language processing (NLP), deep learning, data science, and predictive analytics. When used together correctly, these tools serve a specific use case allowing us to generate knowledge from the resulting data. We use NLP to enable human and computer interaction helping us derive meaning from human input. We use ML and deep learning to learn from data and create predictive and statistical models. Finally, we use data science and predictive analytics to extract insights from the unstructured data deriving from multiple sources. All of these tools and techniques allow us to cultivate an environment of meaningful data that is coming from people, sensors, programmable logistics controllers (PLCs) and business systems.
2. “Learn processes through operators”—How do you get the input, how do you log it, how does it feed it back?
Our primary sources of data (inputs) are people, sensors, PLCs, and business systems. In the case of people on the shop floor or operators, we created a very intuitive and easy to use interface that they can use on their cellphones or in the Human Machine Interfaces (HMIs) that are installed in their machines, so they can give us feedback about the root causes of failures and machine stoppages. We acquire this data in real-time and utilize complex machine learning algorithms to generate knowledge that people can use in their day-to-day operations. Currently, we offer web and mobile interfaces so that users can quickly consume this knowledge to make decisions. We then store their decisions in our system and correlate it with the existing data allowing us to optimize their decision-making process through time. The more a set of decisions and conditions repeats, the easier for our system is to determine the expected outcome of a given set of data.
3. Pattern? What patterns? How is it derived? Where did the data come from? How is it displayed to managers/engineers?
We create “digital fingerprints” (patterns) with ALL the data we are collecting. These “patterns” allow us to see how indicators look before a failure occurs, enabling us to then predict when another failure will happen. Data comes from the machine operators, the machines or equipment, our sensors, and other systems that have been integrated to Sensai’s IIOT hub.
We trigger alerts to let managers and engineers know that a specific situation is happening. They are then able to review it in their cellphones as a push notification that takes them to a detailed description of the condition in their web browser where they can review more information in depth.
4. What specifically are you looking for from the pilots?
We are not a cumbersome solution, for us is all about staying true about agility and value creation. We look for pilots that can give us four main outcomes:
– Learn more about our customer needs and how to better serve them
– A clear business case that can deliver ROI in less than 6 months after implementation and can begin demonstrating value in less than 3 months.
– A pilot that is easy to scale up and replicate across the organization so we can take the findings from the pilot and capitalize them in a short period of time.
– A pilot that can help Sensai and its customers create a state of suspended disbelief that technology can truly deliver the value that is intended and that can be quickly deployed across the entire organization.
by Gary Mintchell | Mar 27, 2018 | Automation, Internet of Things, Wireless