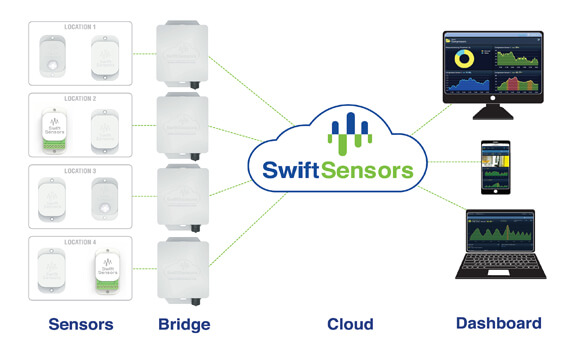
One of the many dreams spurring development of the Industrial IoT was the ability to easily slap sensors around a plant on units and equipment and areas that would report to a database with attached dashboards. The resulting information and visualization would give plant managers and professionals an opportunity for better control of operations and maintenance. Following is a press release from a relatively new entrant in that market segment.
This system from Swift Sensors reminds me of the old ZigBee sensors from a long time ago brought into the modern IoT world with new technologies. This month, the company announced addition of user-defined dashboards to simplify and enhance viewing and analytics of critical sensor data. These new features will help Swift Sensors customers gain deeper insight into “big data” from wireless sensor networks and simplify IoT systems to deliver true value.

“Providing a simple, intuitive cloud dashboard is essential to driving value from a wireless sensor (IoT) system,” says Sam Cece, founder and CEO of Swift Sensors. “Our end-to-end system delivers simplicity and value at all levels — from installation to configuration to data analytics.”
The Swift Sensors cloud-based dashboard allows real-time asset monitoring and sophisticated analytics from anywhere. The enhanced dashboard will allow customers to show sensor data in the manner that’s most relevant to their business, including the option to create multiple views of data streams to identify patterns and correlations.
More details on the new dashboard features:
- Custom Dashboards: Users can now create custom dashboards shared with all account users. Custom Dashboards are user-defined pages with a collection of panels with only the data users want to see, in the order they want to see it.
Customer Use: Aerospace manufacturing company uses custom dashboard to track sensors measuring machine output and utilization. - Set Default Dashboard: Users can select their favorite dashboard to be their default view. When a Dashboard is marked as the default view, the user will be taken directly to this Dashboard upon signing into Swift Sensors.
- Customer Use: A 1000 seat restaurant and banquet facility manager creates default view for walk-in coolers and freezers.
- Combo Chart: The dashboard now supports a new Combo Chart panel. This panel allows up to four measurements to be rendered on the same chart, even if those measurements use different units.
- Customer Use: A large food manufacturer tracks vibration and temperature data to enhance preventive maintenance program.
- Expanded Language Support: Support for six new languages has been added. In addition to English and Japanese, users can now also choose Danish, German, Spanish, French, Italian, and Portuguese.
- Full Screen App behavior on mobile devices: The Swift Sensors Dashboard behaves like a full-screen app on mobile devices, thanks to full-screen support when launched from a Home Screen icon on iOS and Android.
- Incomplete Threshold and Notification Warning: Threshold and notification lists now show a yellow warning icon next to incomplete thresholds and notifications with missing assignments of users, measurements, bridges, and/or sensors
Swift Sensors products are available through a worldwide network of resellers and integrators. All features of the Dashboard are available to Swift Sensors customers through a low annual subscription to the Cloud Dashboard and Analytics, with configurations optimized for the size of the facility.


